As is the case in every asset class under the sun, managed futures investors love to chase performance. The sustainability of a strategy often comes second to double or even triple digit returns. We do our best to discourage such decision making, because in our experience, this is uniquely damaging in managed futures allocations.
The fact is that drawdowns – or extended periods of severe losses – are a fact of life for managed futures investors. There is no way to avoid them; every program goes through them. But in our experience, performance tends to be cyclical for quality programs. They will have a run up, face a drawdown, experience a recovery period, and repeat the process all over again. An investor making allocations at the peak of a run up period usually sets themselves up for losses in the short-term – losses that typically don’t sit well with an investor who was chasing returns in the first place.
However, we’ve found that the best way to explain the significance of such cycles to investors is to show them how it’s happened in the past. In 2010, we did just that, looking into the performance cycles of Clarke Capital. However, with the overarching trend of the asset class’ performance cycling between up and down years being called into question by back to back losing years, and a great deal of the trend following space in drawdown, we thought it would be helpful to take a closer look. Here, we examine the reasons why investors chase performance, the cycle they step into when they do, and what that looks like in an individual track record.
Spoiler alert: it ain’t pretty.
Why do we do what we do?
One of the more common complaints among investing professionals is that investors tend to make emotional decisions about their money. In this case, it’s best to just equate emotional with irrational – not because emotions are a bad thing, necessarily, but because they have no place in most investment portfolios.
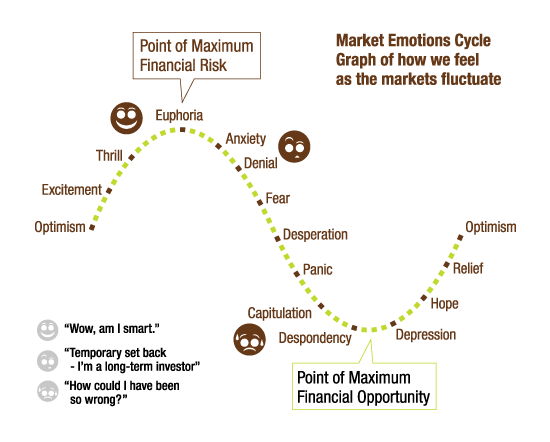
On the traditional side of investing, this effect can be very pronounced. An investor may read a report about a given stock tanking on a news report, and immediately want to sell to avoid further losses… ignoring whatever context might indicate that the losses are likely short term. An investor may, conversely, read a report about a “hot” new company, and believe it to be a sound stock purchase… ignoring whatever trends might indicate weakness supporting the surge. The result is that investors end up buying in and the highs and getting out at the lows, losing a great deal of money in the process. One of our favorite bloggers, Barry Ritholtz, has a great graphic on the subject:

No, that’s not supposed to be an equity curve (talk about an unrealistic distribution of data), and no it’s not perfect, but you get the idea. Investor emotions can get tied to the present value of an investment, clouding their judgment on what they should do about tomorrow.
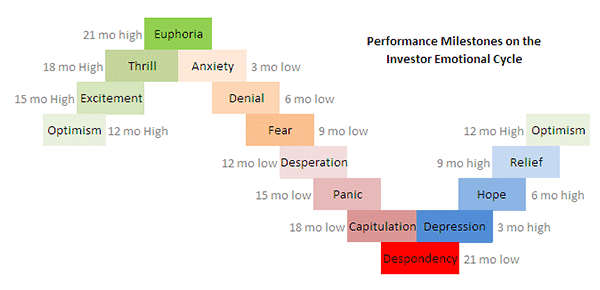
Managed futures doesn’t have the exact same type of behavior, as investors allocations are not tied to supply and demand the way they are in vehicles like stocks. However, as we’ve discussed in past newsletters, that doesn’t mean that managed futures investors are immune from chasing performance. No, quite the contrary – they love to chase performance. Their chart just looks a little different than the one used by Ritholtz, because they often are chasing an equity curve:

We tied the emotions in Ritholtz’s chart with actual performance levels on an equity curve when analyzing managed futures investors’ emotional ties. Obviously, this chart isn’t an actual equity curve, but it correlates, in our experience, with the investor behavior we see so frequently. Is a manager making new 12 month highs? Optimism. New 21 month highs? Euphoria. Are they plummeting lower and at an 15 month low? Panic. A 6 month high after a drawdown? Hope.
The problem with tying these emotions to the highs and lows of an equity curve is that managed futures performance, in our experience, tends to be somewhat cyclical in nature. That means the point at which you are despondent and want to quit can be the exact time you should actually be getting in more, not out. And that when you are happiest and looking to add more, that is probably the time you want to be taking some off the table. The end result for many is a failure to break the cycle of emotional investing and chasing performance, where you probably won’t have a great time in the managed futures space. The best way to explain what we mean is to show you what a cycle is.
The Circle of (Performance) Life
It was high time that we updated our 2010 cyclical performance analysis. This time, to do a more robust test, we pulled data on 6 of the longest track record managers we know of: Mark J. Walsh & Company, Standard, Millburn Ridgefield Corporation, Diversified Program, John W. Henry & Company, Inc., Financial & Metals, EMC Capital Management, Inc., Classic, Chesapeake Capital Corporation, Diversified Program and Campbell & Co., Inc., Global Diversified (Large). Is this representative of the entire asset class? Of course not, but these programs are some of the longest lasting, so if there were a cycle to identify, this would be the data where we’d find it.
We defined a major drawdown as lasting at least 6 months and over -10%, -15%, or -20%, depending on the program and its volatility. The recovery period is defined as the gain from the drawdown valley (the low point) to a new equity high. The run up period is defined as the period from the end of the previous major drawdown (the new equity high) to the last new equity high before new major drawdown.
There were 10 major drawdown cycles per program on average, meaning we were able to analyze 60 different major drawdown periods in track records going back a maximum of 36 years. What did we find? With the caveat that past performance is not necessarily indicative of future results, we found what we expected to.
The average major drawdown was about 9 months long, while the longest was 31 months and the shortest was (for our purposes) 6 months. This gives you a glimpse of what drawdowns encompass. It’s not a single month of painful losses (although those can and do take place) – it takes place over much longer periods of time, which is why making emotional investment decisions can be so tempting.
But the move from the peak to a new low isn’t the only troubling part for investors – there is also the fight back to even – what we call the recovery period. The average recovery period in our test was 9.5 months. This is where having a larger sampling of programs provides a bit of a clearer picture. In our 2010 take, we found the drawdown period to be much longer than the recovery for Clarke Capital Worldwide. For these industry stalwarts, though, the recovery lasted about the same duration.
The average run up period was 17 months. This is uniquely important when you think about what it means in terms of chasing performance. In our experience, annual performance resonates most strongly with the performance chasers. When a program has a banner year (read: is in the midst of a run-up), investors sit up and begin to pay attention.
Let’s assume an average 17 month run up that begins in January of any given year. The following January, investors become interested. It then takes maybe a couple of months for them to make a decision on allocating. That means, assuming the average, they get three months of positive performance before staring down an average of 9 months of losses. And then another 9 months of recovery where it isn’t entirely clear the program will ever get back to even.
Again, that’s using our assumptions; investors could very well allocate the very month that the drawdown begins and get none of the run up. And we wonder why performance chasing investors have a rough time of it in the managed futures space…
On average, the entire cycle- run up, drawdown and recovery- was 35.5 months, or just short of three years. This is why we advise investors to view managed futures as a 3-5 year investment; it’s just about the right timeframe in which to view a full cycle of performance, giving you the ability to make informed allocation decisions.
Overall, this reflected what we knew to be true – that managed futures performance tends to cycle for individual programs. This is why we do things like encourage you to buy a drawdown. It might cause a bit of queasiness to buy something that’s losing, but the pervasiveness of the performance cycle in the space means it’s just sensible.
A Micro Glimpse
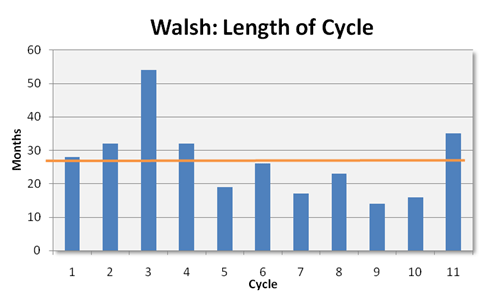
Averages are all fine and well, you might be thinking, but what does this mean in terms of a track record? To help understand how this data manifests, we took a look at Mark J. Walsh & Company. In analyzing Walsh, we found that the program had around 11 defined performance cycles in their track record of varying durations:

The variance in length of cycle for Walsh is indicative of an important truth to remember when doing this analysis- past performance is not necessarily indicative of future results. While we can discuss the general trend of cyclical performance in the managed futures space, there is no way to predict whether the next cycle will last 9 months or 50. In other words, evaluating where a manager is in a cycle can give you a vague notion on timing, but it will never guarantee a specific outcome.
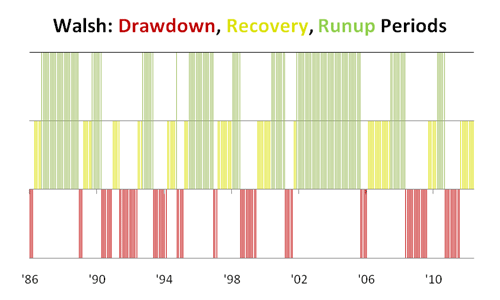
However, it’s not just about the length of the performance cycle; it’s also about the length of the phases within the performance cycle. The chart below plots out the run up (green), drawdown (red), and recovery (yellow) phases in Walsh’s track record, going all the way back to 1986.

This chart has a couple of takeaways. You’ll notice that, while the run up periods dominate the chart visually, the run up periods are not mere flashes in the pan. This flies in the face of conventional managed futures wisdom. Many a salesman out there has described the asset class as being a game of small losses and large, infrequent wins… but the data (in the aggregate and in Walsh’s case) suggests that there can be periods of small gains outside of options traders, as well.
To be entirely fair, we have to remember that these charts are looking at duration- not severity. Some of those run ups may have been triple digit gains, while some may have been single digit. Some of those drawdowns may have been one severe month of losses followed by five months of small losses, while some may have been single digit losses stretched out over the course of a year. Consistent cycle length does not guarantee a program will perform. Indeed, our inclusion of now defunct John W. Henry in our aggregate analysis proves this.
Had we evaluated cycles by magnitude, the number of periods in question would have been much higher. By filtering out shorter bursts of up and downside volatility, we eliminate a lot of the noise. Perhaps that’s another lesson worth considering as you making ongoing judgments of programs. Performance periods of six months or less are more likely to push you onto an emotional investing rollercoaster than they are to help you gain investable insights.
Further, perhaps quality really is about consistency. Walsh has what is, in our opinion, a solid program, and the ratio of green and yellow to red in those bars reflects part of the reason that he’s been around so long. The ability of a manager to deliver more gains than losses is part of the reason that investors are willing to stick around through the drawdowns; they’re comfortable enough with the upside of the cycle to tolerate the down ticks. It’s not about never losing; it’s about how you lose.
Finally, you’ll notice Walsh appears to be in the midst of a recovery phase. If you’re looking to get in before the run up, time may be running short (acknowledging, of course, that history is not guaranteed to repeat itself). Just sayin’.
Conclusion
We understand the emotional investing cycle. After all, you’ve worked hard to save over the years. Your investment portfolio is about setting up a better future for yourself and your loved ones. There’s nothing wrong with being protective of what you’ve built.
There is something wrong with letting emotions guide your investment decisions, though, particularly in the managed futures space. When performance itself can be cyclical, the emotional investing cycle is your worst enemy. Your best bet? Take a deep breath, and let the data be your guide.
by Attain Capital